

It’s not just Iran
The war in Iran continues to be the most visible factor driving global equity market returns. For example, the MSCI equity index for oil exporter Norway has gained over 6% since 27 February, while Thailand, an oil importer, has seen its market fall by nearly the same amount.
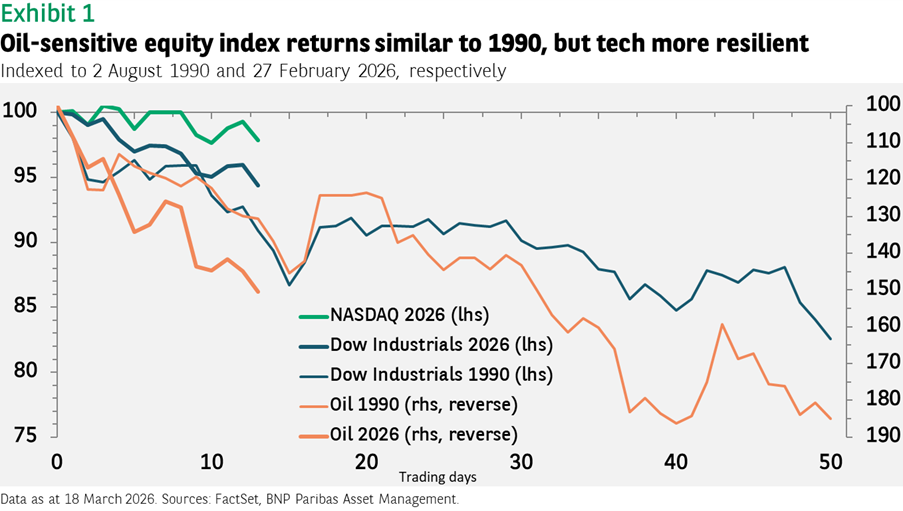
In contrast to the (mistaken) investor assumption that markets would react to an attack on Iran in a manner similar to how they did after the 12-day war last year, equity markets have instead moved more like they did following the outbreak of the Gulf War in 1990.
This is a worrisome parallel insofar as global equities ultimately declined by 18% over the two months following the start of that conflict before bottoming out. Oil prices rose by 85% over the same period.
The reason for the extended decline in 1990 was that it coincided with a US recession, which was itself partly triggered by the oil shock. In addition, policy rates were high (the fed funds rate was at 8%) and the savings and loan crisis had triggered a credit crunch. Today, the US economy is in a far better position, even if the most recent revision to fourth quarter GDP data shows growth has slowed sharply from the previous two quarters.
While returns from the oil-sensitive parts of the US equity market (as measured by the Dow Jones US Industrials Index) have been similar to those in 1990, the technology sector has performed much better, contributing to superior returns for the S&P 500 (see Exhibit 1). It is worth nothing that the decrease in equity markets in 1990 mirrored the increase in oil prices. If we see a stabilisation in oil prices today around $100 per barrel, equity markets may also stabilise.
This dynamic points to a key factor in recent market returns that may have been missed given headlines focusing on the daily swings in oil prices and the consequent moves in equity markets.
A major factor driving recent equity returns has been the unwinding of extended long and short positions that had built up during February, many of them related to the volatility in artificial intelligence-linked sectors (see Exhibit 1).
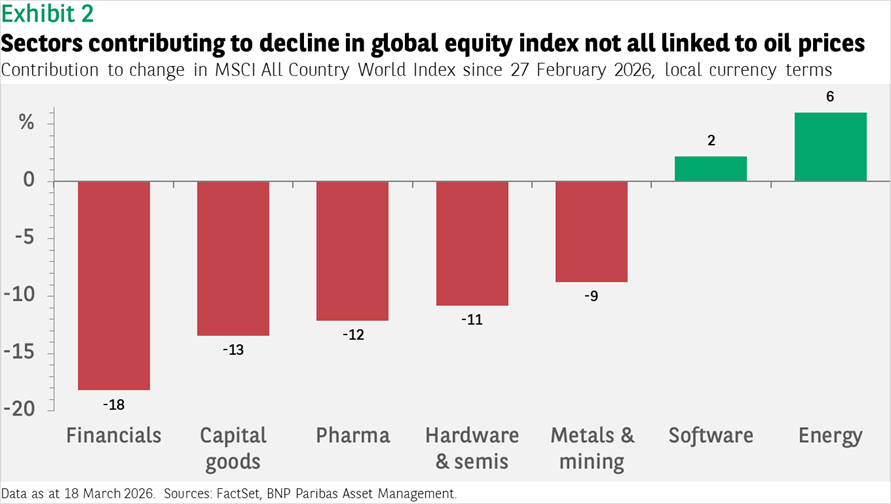
For example, the industry contributing the most to the 4.2% decline in the MSCI All Country World Index (in local currency terms since 27 February 2026) has been financials, driven at least partly by ongoing worries about private credit. The fall in capital goods reflects higher oil prices and worries about global growth, but not the drop in technology hardware and semiconductor stocks, which had gained significantly in February.
The negative figure for metals and mining mirrors the drop in gold and silver prices (also previously big winners). On the plus side of the ledger, energy stocks have naturally done well, but the gain in software stocks is another example of the reversal in February’s sector returns.
The implications of this for investors are twofold. One should potentially have a list of allocations linked to oil prices to make once the Iran war ends, anticipating a reversal of the winners and losers to that point.
But equally, one also needs to maintain a view on AI-related sectors and evaluate their attractiveness based on the earnings outlook and valuations at that time, with the advantage that positioning by then should hopefully be less extreme with market prices therefore less susceptible to big swings.


Disclaimer
This document is for informational purposes only and does not constitute investment research or financial analysis relating to transactions in financial instruments as per MIF Directive (2014/65/EU), nor does it constitute on the part of BNP PARIBAS ASSET MANAGEMENT Europe or its affiliated companies an offer to buy or sell any investments, products or services, and should not be considered as solicitation or investment, legal or tax advice, a recommendation for an investment strategy or a personalized recommendation to buy or sell securities.
Due to its simplification, this document is partial and opinions, estimates and forecasts herein are subjective and subject to change without notice. There is no guarantee forecasts made will come to pass. Data, figures, declarations, analysis, predictions and other information in this document is provided based on our state of knowledge at the time of creation of this document. Whilst every care is taken, no representation or warranty (including liability towards third parties), express or implied, is made as to the accuracy, reliability or completeness of the information contained herein. Reliance upon information in this material is at the sole discretion of the recipient. This material does not contain sufficient information to support an investment decision.
Issued in the UK by AXA Investment Managers UK Limited, which is authorised and regulated by the Financial Conduct Authority in the UK. Registered in England and Wales, No: 01431068. Registered Office: 22 Bishopsgate, London, EC2N 4BQ.
AXA IM and BNPP AM are progressively merging and streamlining our legal entities to create a unified structure
AXA Investment Managers joined BNP Paribas Group in July 2025. Following the merger of AXA Investment Managers Paris and BNP PARIBAS ASSET MANAGEMENT Europe and their respective holding companies on December 31, 2025, the combined company now operates under the BNP PARIBAS ASSET MANAGEMENT Europe name.