

Pick your poison: Geopolitics or AI
If it’s not geopolitical shocks roiling markets it is artificial intelligence, either because AI is a bubble, or because it is decidedly not but it will instead wreak havoc across business models and the labour market.
The news over the last week has highlighted different aspects of AI’s disruptive power. Announcements of even greater capital expenditure from companies such as Google’s owner Alphabet point to lower margins. The increasing availability of open-source AI tools means that revenues for competitors will be lower (weakening the justification for high capital expenditure). The extent of the impact on the labour market and consumer demand of AI’s creative destruction, as the skills of professionals suddenly become far less valuable and jobs are lost, is difficult to quantify.
AI’s newness as a market factor, alongside the fierce competition within the industry, means these sorts of surprises are to be expected (remember DeepSeek?). Since last summer, technology sector volatility has been twice as high as for the rest of the market.
It will take time for analysts to assess the net impact of all these factors and for earnings expectations to adjust, hence caution in the short term is in order. Nearly half of the companies in the Nasdaq 100 index have yet to announce their results. While earnings growth for those companies already reporting look strong, 11% in aggregate, that is only in line with expectations, when investors are accustomed to larger positive surprises each quarter (for the S&P 500, earnings growth is higher (14%) as are surprises (8%), helping to explain why non-tech stocks are outperforming).
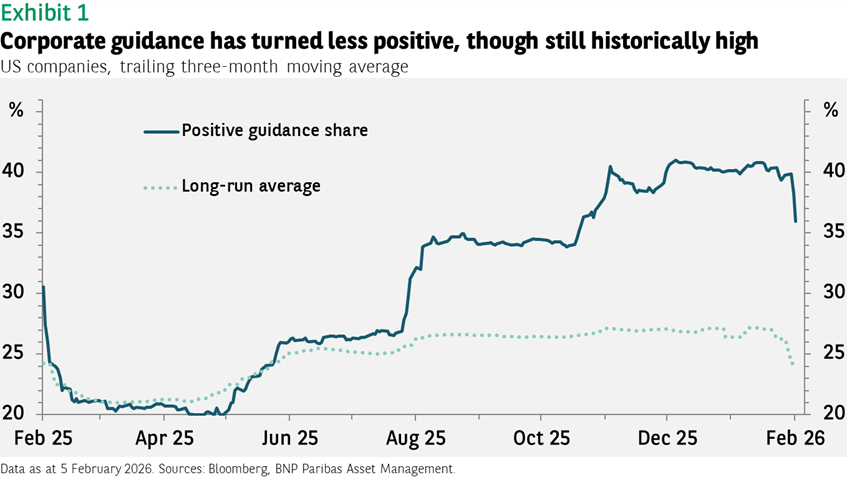
In addition to disappointing results, CEOs are becoming less upbeat about the future. The share of positive guidance provided by companies has fallen back, though it is still at an historically high level (see Exhibit 1).
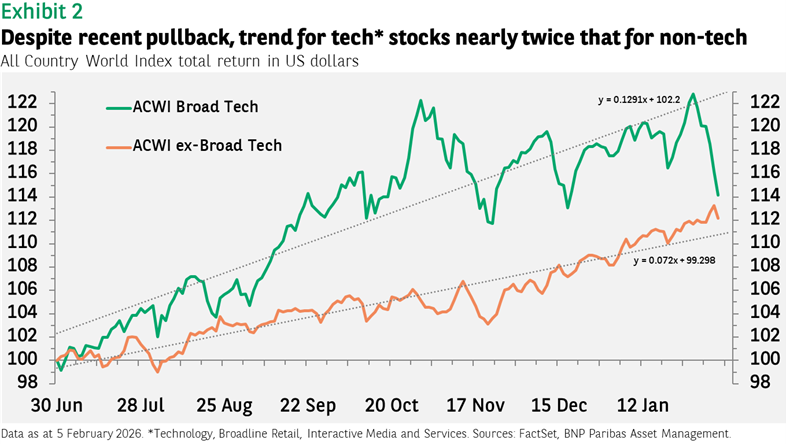
Even if it is wise to be cautious tactically, we are still optimistic strategically. Along with the volatility in tech stocks have come superior returns (though admittedly not recently). Since last summer the slope of the trend line for global tech stock performance is nearly twice as high (see Exhibit 2).
While the earnings growth rate for tech stocks may be revised downwards, it is still likely to be far better than that for non-tech stocks. Currently, tech profits are expected to rise 31% this year compared to just a 10% gain for non-tech stocks (2025 rates are 26% and 6%, respectively). The size of that gap means it will be difficult for non-tech stocks to sustainably outpace tech stocks without a significant deterioration in the outlook for the latter’s profits, or a reduction in the multiple on tech earnings.
The valuation risk is arguably greater for value stocks than for tech. The z-score1 for the forward price-earnings (P/E) ratio for the Nasdaq 100 is 0.2, while the ratio for emerging market tech stocks is at its long-run average (a z-score of zero). The score for some value indices, however, is far higher. The MSCI Japan index and the Russell 1000 Value index have P/E z-scores of 1.8. The partial exception is Europe, where the score is 0.5, a decent amount above average but not extreme.
Recent events simply reinforce the importance of diversification in tech sector exposure across industries and regions (both developed and emerging). While always valuable for a portfolio, it is all the more critical given the rapid developments in the tech industry. Almost any player can be disrupted, but the likelihood is that the disruptor will be somewhere else within the index. Losses on any one stock should be compensated by gains in another and aggregate earnings should continue to rise.
- A measure of the current value of a metric relative to the long-run average, scaled for volatility. The more a z-score is above zero, the higher the metric is above average.
Tail risks
The recent surprise in the January US manufacturing sector ISM index, which jumped to 52.6 (expansionary territory) after 10 months of sub-50 readings, highlights one of the risks to the positive outlook for US equities this year. GDP growth has averaged 4.1% over the last two quarters and the Atlanta Fed’s GDPNow estimate stands at 4.2%, well above the potential long-run growth rate of the economy (around 1.8%). Given that inflation may move back up in the months ahead as shutdown and weather distortions fade, it may be challenging for the Federal Reserve to deliver the two cuts in the fed funds rate that markets expect. Much will depend on labour market developments, with labour supply increasing as companies lay off workers and replace them with AI tools, while supply is simultaneously shrinking thanks to deportations. The adjustment of equity markets to fewer (or no) cuts from the Fed would likely be painful as the increase in the discount rate pushes down the multiple, particularly for tech and small cap stocks. Once the adjustment has been made, however, the outlook for strong economic growth and slightly higher inflation would likely support subsequent gains in markets.
Performance data/data source: Bloomberg, FactSet, BNP Paribas Asset Management, as of 5 February 2026, unless otherwise stated. Past performance should not be seen as a guide to future returns.


Disclaimer
This document is for informational purposes only and does not constitute investment research or financial analysis relating to transactions in financial instruments as per MIF Directive (2014/65/EU), nor does it constitute on the part of BNP PARIBAS ASSET MANAGEMENT Europe or its affiliated companies an offer to buy or sell any investments, products or services, and should not be considered as solicitation or investment, legal or tax advice, a recommendation for an investment strategy or a personalized recommendation to buy or sell securities.
Due to its simplification, this document is partial and opinions, estimates and forecasts herein are subjective and subject to change without notice. There is no guarantee forecasts made will come to pass. Data, figures, declarations, analysis, predictions and other information in this document is provided based on our state of knowledge at the time of creation of this document. Whilst every care is taken, no representation or warranty (including liability towards third parties), express or implied, is made as to the accuracy, reliability or completeness of the information contained herein. Reliance upon information in this material is at the sole discretion of the recipient. This material does not contain sufficient information to support an investment decision.
Issued in the UK by AXA Investment Managers UK Limited, which is authorised and regulated by the Financial Conduct Authority in the UK. Registered in England and Wales, No: 01431068. Registered Office: 22 Bishopsgate, London, EC2N 4BQ.
AXA IM and BNPP AM are progressively merging and streamlining our legal entities to create a unified structure
AXA Investment Managers joined BNP Paribas Group in July 2025. Following the merger of AXA Investment Managers Paris and BNP PARIBAS ASSET MANAGEMENT Europe and their respective holding companies on December 31, 2025, the combined company now operates under the BNP PARIBAS ASSET MANAGEMENT Europe name.