

Time for the Fed
Weak US employment data has fuelled expectations that the Federal Reserve (Fed) will cut rates by 1.5 percentage points (ppt) over the next year. That would be aggressive, and consistent with a much weaker economy. Soft jobs data could be the harbinger. So, either bond markets or equities are wrong. If bonds are right, the economy is losing speed and that should ultimately hit risk assets. If stocks are right, lower interest rates will sustain growth and earnings, and bond yields will need to go back up again. It is all to play for in the markets.
- I still like UK gilts versus Treasuries, and the euro vs. dollar with the European Central Bank now on hold
- I am concerned about the potential for a risk-off period in the fourth quarter (Q4)
US rate cutting to resume
A 25-basis-point (bp) cut in the Fed Funds Rate on 17 September now looks certain. Market expectations are driven by evidence of a marked weakening in US employment over recent months. The unemployment rate is just up 0.3ppt this year and only 0.9ppt above its cyclical low, and the Sahm Rule – a recession indicator – has not been triggered, but other jobs data does suggest a downshift in demand. Benchmark revisions to estimates of total non-farm payroll jobs suggest 911,000 fewer jobs as of March 2025. More recent data shows stalling job creation, with only 107,000 created since April. In addition, weekly data on unemployment insurance claims jumped 263,000 in the week of 6 September, the biggest increase for four years. It could well be that the jobs data suggests a recession is potentially around the corner.
Labour weakness key
Historically, rate cuts have come in response to weak labour market data. This could be the case again, even with inflation still above target. Consumer prices rose by 0.4% in August, nudging the annual rate to 2.9%. It is likely to breach 3.0% next month, as the core measure already has. While evidence of tariffs causing higher prices for consumers is still not that clear in the official data, it is not absent. The Consumer Price Index (CPI) has risen by 1.0% in the last four months compared to 0.7% in the first four months of 2025. In the same period to August 2024, CPI was up just 0.3%. There is still plenty of room for the new tariff regime to be reflected in the inflation data. The Fed cutting as inflation is rising will not be a good optic, but fears of a recession are still likely to be more important in driving the bond market. Indeed, concerns about growth over the coming quarters should give the Fed confidence in its forecast that inflation, related to tariffs, will be temporary. There are almost three quarter-point rate cuts priced in for the rest of the year, with a further three priced for 2026. At the time of writing, the 10-year Treasury yield had fallen through the 4.0% mark.
But cuts drive positive momentum
The equity market is more excited about lower short-term rates and bond yields than a weakening jobs market. It seems that only evidence of a broader growth slowdown hitting corporate profitability would be needed to stop the stock market rally – the possibility of the S&P 500 index reaching the 7,000 mark is being openly discussed in Bloomberg and CNBC studios. The consensus view on earnings remains positive. For the S&P 500, earnings-per-share is expected to grow by more than 12% over the next year, and the balance of forecast revisions is still positive. Only the consumer staples, energy and utilities sectors are estimated to have earnings growth below 10%. Profit margins have remained strong, with the information technology sector consistently posting margins above 20%.
Margins remain solid
It is hard to understand where tariffs might be hurting the US economy. The rise in consumer prices is modest. The federal government is taking in tariff revenue. So, someone is paying - and it must be, mostly, corporate America. This may show up in lower profits at some point. There were modest dips in margins for consumer staples and materials in Q2, which could be tariff related. Revenue growth has started to weaken; Q2 saw revenue declines for consumer discretionary and staples, industrials and financials. But health, materials and technology firms saw big increases. These are the numbers to watch closely because if revenue starts to slide and margins come under pressure, earnings growth will be hard to sustain.
Turkeys, Christmas and all that…
The prospect of Fed easing is driving valuations. The US equity market is at a record high and its 12-month forward price-earnings ratio is 22 times. Bond yields are moving down in the US, with curve steepening halted for the time being – the benchmark 30-year Treasury bond yield is 40bp lower than where it peaked this year in May. Credit spreads remain tight, and the credit default swap crossover index in Europe is at its lower level since the beginning of 2022. Arguably the US macroeconomic backdrop has worsened – lower growth and higher inflation – and the policy backdrop has remained murky (questions over the independence of the Fed). It is hard to argue that investors should be committing more capital to the US market. But risk-on momentum remains strong.
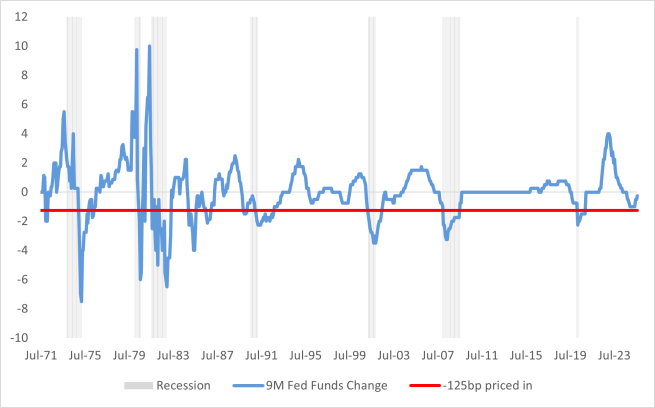
If the market is right on the Fed, then it could be pricing in a recession. The chart below shows nine-month changes in the Fed Funds Rate. I have indicated the 125bp in cuts that are priced in between now and June next year. On numerous occasions when the Fed has eased by that amount over a nine-month period, the US has experienced a recession. Whether that observation holds again is crucial, given where both bonds and equities are currently priced. If the Fed genuinely responds to weaker jobs growth and stable inflation, then equities and bond yields should move lower. If the Fed is forced into easing and inflation moves higher, more curve steepness and a weaker dollar is likely to be the outcome. Fed Chair Jerome Powell’s words on 17 September will be very interesting.
Glittering prize
Finally, the dollar price of gold hit a new high this week. Its price appreciation during 2025 has beaten most stock markets. It has significantly outpaced US inflation since the pandemic, save for a brief period when the Fed was tightening. Indeed, this century, gold’s real price in US dollar terms has risen over 500%. Concerns about inflation, debt debasement and the fragility of the fiat currency system are reasons cited to explain the massive rise in its price. Dubai style, Oval Office chic and the preponderance of crypto billionaires might be other reasons. What I do not think, is that it reflects a shift away from US dollar assets. Central banks hold gold, but in nominal terms it only accounts for around 15% of total reserve assets. Official monetary institutions have increased their physical gold holdings in recent years – that process has been going on since around the time of the global financial crisis. In the 20 years prior to that, gold reserves had been in decline (the then UK Chancellor of the Exchequer, Gordon Brown, famously sold 396 tonnes of the UK’s physical reserves of gold in the late 1990s/early 2000s). Today, physical gold holdings at central banks, according to International Monetary Fund data, stand at roughly the same level they were at in the early 1970s. Some investors might prefer gold to Treasury securities or money, but the world’s official reserve system is not shifting its reserve assets massively away from government bonds for that shiny, precious metal. Indeed, given today’s price, might some opportunistic finance minister be tempted to follow Mr Brown’s example? It would certainly help the fiscal numbers somewhere - at today’s price, what the UK sold in the late 1990s would raise somewhere around $30bn/£25bn; that would help fill the fiscal black hole.
Performance data/data sources: LSEG Workspace DataStream, ICE Data Services, Bloomberg, AXA IM, as of 11 September 2025, unless otherwise stated). Past performance should not be seen as a guide to future returns.


Disclaimer
This document is for informational purposes only and does not constitute investment research or financial analysis relating to transactions in financial instruments as per MIF Directive (2014/65/EU), nor does it constitute on the part of AXA Investment Managers or its affiliated companies an offer to buy or sell any investments, products or services, and should not be considered as solicitation or investment, legal or tax advice, a recommendation for an investment strategy or a personalised recommendation to buy or sell securities.
Due to its simplification, this document is partial and opinions, estimates and forecasts herein are subjective and subject to change without notice. There is no guarantee forecasts made will come to pass. Data, figures, declarations, analysis, predictions and other information in this document is provided based on our state of knowledge at the time of creation of this document. Whilst every care is taken, no representation or warranty (including liability towards third parties), express or implied, is made as to the accuracy, reliability or completeness of the information contained herein. Reliance upon information in this material is at the sole discretion of the recipient. This material does not contain sufficient information to support an investment decision.
Issued in the UK by AXA Investment Managers UK Limited, which is authorised and regulated by the Financial Conduct Authority in the UK. Registered in England and Wales No: 01431068. Registered Office: 22 Bishopsgate London EC2N 4BQ
In other jurisdictions, this document is issued by AXA Investment Managers SA’s affiliates in those countries.
AXA IM and BNPP AM are progressively merging and streamlining our legal entities to create a unified structure
AXA Investment Managers joined BNP Paribas Group in July 2025. Following the merger of AXA Investment Managers Paris and BNP PARIBAS ASSET MANAGEMENT Europe and their respective holding companies on December 31, 2025, the combined company now operates under the BNP PARIBAS ASSET MANAGEMENT Europe name.